
An astronaut stands in a modern office, while colleagues work on computers.

Engineering decisions are financial decisions.

Economic Performance Strategy

Most technology investments are scoped before anyone has put a number on the bottleneck they're fixing, which means the economic outcome gets decided before the project starts. Sparq starts every engagement the same way: identifying where margin is leaking, what it costs, and what fixing it is worth before architecture or delivery begins.

The Reality

Most technology strategies are measured on delivery instead of economics.

The project delivered on time. The vendor hit every milestone. And twelve months later nobody can say what it returned. The scope was set before the bottleneck was priced. The metrics tracked delivery, not economics. And once the architecture is set, the cost of correcting it compounds fast.

Learn More

The longer operational bottlenecks stay hidden, the more expensive every technology investment becomes.

Most partner evaluations score the wrong things.

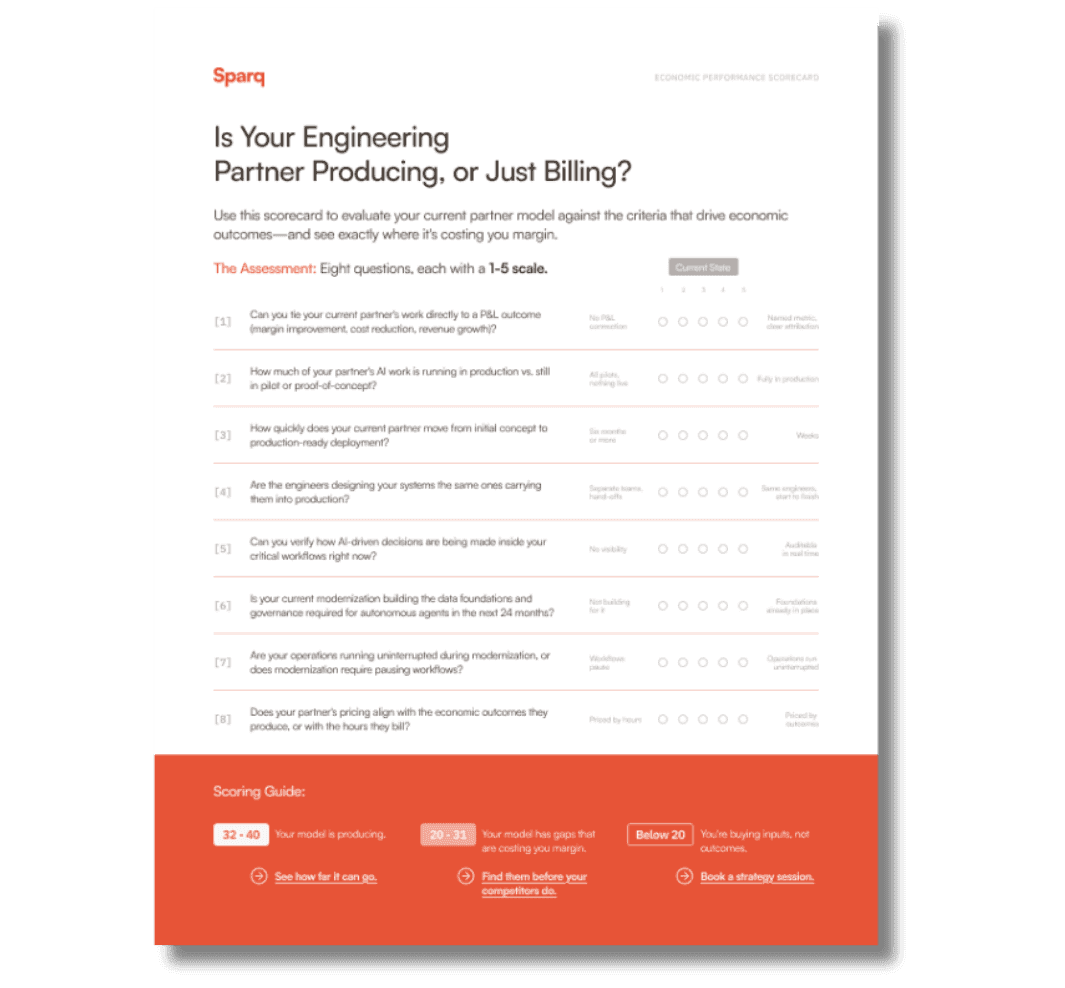
Rates. Team size. Delivery methodology. Certifications. Those metrics measure what you're buying. They do not measure what the engagement is likely to produce. The Economic Performance Scorecard evaluates on outputs: economic impact, production readiness, operational risk, and speed to measurable value. Use it to assess whether your current partners are engineering earnings or billing hours.

Webpage with a questionnaire titled 'Is Your Engineering Partner Producing, or Just Billing?'

In Production

What economic performance engineering delivers.

$90M

annual gross margin increase

99%

reduction in processing time

90%

reduction in manual work

<20

days to production

$90M in annual gross margin engineered into an active fleet operation.

A global mobility leader's high-volume asset decisioning workflow was running on manual analysis and reactive pricing. Sparq identified the bottleneck, modeled the economic opportunity, and built an AI decisioning engine generating $50-$100 in additional revenue per vehicle. $90M in annual gross margin. Core platform untouched.


→ Read the full case study

How we work

How Sparq engineers economic performance.

1. Identify where margin is leaking

We map the operational workflows where margin is being lost or left on the table: manual bottlenecks, decision latency, exception leakage, and technology investments that haven't produced the returns they were funded to deliver.

2. Quantify the economic opportunity first

We put a number on the opportunity first. What does the bottleneck cost per quarter? What does fixing it produce in margin, throughput, or decision speed? The economic case drives the scope, not the other way around.

3. Deploy proven patterns where the problem is already solved

We don't start from scratch. Proven delivery patterns and pre-built AI foundations handle what's already been figured out across prior engagements. Custom engineering concentrates on the workflows that move your specific economics.

4. Measure against the outcome the investment was funded to deliver

We track against the economic outcomes the engagement was built to deliver, not the delivery milestones we hit. Margin improvement, throughput gains, and decision speed are measured from day one, not reported in a post-project retrospective.

Capabilities We Deploy

Built to find the economic opportunity, prove it, and deliver it.

Red circle with vertical black stripes on a black background.

Economic and operational analysis

Operational bottleneck identification, workflow economics, and margin mapping designed to expose where decision latency, manual friction, and fragmented execution are suppressing business performance.

A red dot with multiple lines radiating outwards on a black background.

Modernization and execution strategy

Architecture evaluation, modernization sequencing, and technology investment planning built around operational adaptability, production readiness, and long-term economic impact.

Abstract graphic showing broken circles, a red orb, and fanned light pink rectangles.

AI-enabled operational execution

Embedded intelligence, workflow automation, and AI-driven decision support deployed directly into live operational systems without disrupting the workflows already running the business.

Three red circles connected by curved white lines, indicating an upward trend with an arrow.

Production-ready delivery and governance

Operational observability, execution controls, and scalable governance engineered to support real-world deployment, adoption, and safe execution under production load.

A dark grey letter S on a black background, possibly a company logo.

The Shop

Abstract design with vertical orange bars of different heights on a black background.

Intelligence Studio

Learn More

The longer operational bottlenecks stay hidden, the more expensive every technology investment becomes.