How to Assess Technical Debt Across an Enterprise Portfolio
Learn how to assess technical debt across an enterprise portfolio in five steps: inventory, dependencies, code health, CVEs, and a prioritized roadmap.

CFOs, COOs, and VPs of Engineering: enterprise engineering organizations spend between 21% and 40% of their total IT budget servicing technical debt, according to Deloitte's 2026 Global Technology Leadership Study. This is a significant cost. For a company running $50M in annual IT spend, the midpoint of that range means $15M consumed before a single new feature ships. Unquantified debt also blocks AI adoption, stalls cloud migration, and turns every modernization business case into a guess. AI-assisted development adds a new pressure: code written with AI tools can accumulate debt quickly, even in young codebases, when teams lack architectural guardrails. This guide provides a repeatable, step-by-step framework to identify, prioritize, and remediate technical debt across an entire application portfolio, so you can reclaim that spend and invest it where it compounds.
What technical debt actually costs at the portfolio level
Maintenance spend and margin erosion
Technical debt compounds silently. Individual teams absorb it as longer sprint cycles, extra regression testing, and hardening sprints that produce zero customer value. Aggregated across a portfolio of dozens or hundreds of applications, the effect is structural margin erosion. Gartner projects that architectural technical debt, the kind that cuts across multiple systems and architecture layers, will account for 80% of all technical debt by 2027.
That means the most expensive debt is not inside any single codebase; it lives in the seams between systems, in duplicated services, and in tightly coupled modules that no single team owns.
When leadership lacks visibility into where debt sits and what it costs, every capital allocation conversation becomes anecdotal. CFOs cannot defend a $3M modernization initiative when the baseline cost of inaction is unmeasured. COOs cannot sequence transformation programs when no one can say which applications are load-bearing and which are candidates for retirement.
AI can create debt as fast as it helps ship code
Technical debt is no longer only a legacy problem. The mechanism is plausible even in a codebase that is two years old: AI tools make it cheap to produce code, but they do not by themselves enforce shared architecture, reuse existing services, or keep dependencies current. Left unchecked, that can mean more duplicated logic, inconsistent patterns across teams, and a growing volume of code that reviewers must understand before they can trust it. A newer application can therefore carry architectural debt sooner than its age would suggest. This is why assessment is not a one-time cleanup of old systems. It is a baseline to measure against, and a way to set guardrails (standards, dependency policies, architecture review, automated scans in CI) before generated code multiplies across the portfolio.
Forfeited AI readiness
AI initiatives depend on clean data pipelines, well-structured APIs, and modular architectures that accept new inference layers without destabilizing production. Debt-laden systems deliver none of these. Tightly coupled monolithic codebases can make it harder to add ML models, though well-designed API layers can often reduce that friction.Undocumented data flows make feature engineering unreliable. Recent research indicates that AI-assisted development itself accelerates debt accumulation by 30–41% when teams lack the architectural guardrails to absorb generated code. The implication is clear: organizations that skip the assessment step before layering on AI are compounding the very problem they intend to solve.
Growth constraints
Every quarter that debt goes unaddressed, the cost of change rises. Release velocity slows. Security vulnerabilities accumulate, since unpatched CVEs in transitive dependencies are a direct artifact of unmapped dependency trees. Compliance audits consume more engineering hours. Acquisition integration timelines stretch. The economic case for a portfolio-level technical debt assessment is not just engineering hygiene; it is the prerequisite for every growth initiative on the roadmap.
The debt that never shows up in the code
Not all of the risk in an application portfolio lives in source code. Every system sits inside a web of processes that nobody wrote down: the manual workaround someone runs every month-end, the spreadsheet that reconciles two systems that do not talk to each other, the approval that happens over email, the one person who knows why a batch job has to run before noon. These undocumented dependencies often carry real business weight, and they are invisible to static analysis and dependency scanners. They surface at the worst moments: during a migration cutover, after a key employee leaves, or when an AI initiative assumes a clean data flow that does not exist. A portfolio assessment that stops at the repository will miss them, and a modernization plan built without them can break the business processes it was meant to improve.
A step-by-step portfolio assessment framework
The most reliable progression follows these steps: identify the debt, prioritize it by business impact, then plan remediation in sequenced waves. Below is how to execute each phase across an enterprise portfolio, not just a single repo.
Step 1, identification: map the portfolio
Before you measure anything, you need to know what you have. Identification means building a complete inventory of applications, services, and shared components, then scanning each for structural, security, and architectural debt indicators. Wire automated static analysis across every repository in scope. Scan for code duplication, cyclomatic complexity, dead code, and test-coverage gaps. Simultaneously, run software composition analysis to surface outdated dependencies, known CVEs, and license risks in third-party libraries. Map inter-service dependencies to expose tight coupling and architectural drift.
Map what happens outside the code as well. For each in-scope application, interview the people who run it day to day and trace the business processes that depend on it: manual steps and workarounds, spreadsheets and shadow tools, hand-offs between teams, scheduled jobs and their informal owners, and data that is re-keyed between systems. Record who performs each step, how often, and what breaks if it stops. Treat these findings as first-class inventory, not footnotes.
Capture business intent alongside the technical findings. For each application, record what leadership plans for it: upcoming ERP or platform migrations, a planned integration platform, tool consolidation, acquisitions or divestitures, and contract or license end dates. Ask who owns that decision and when it lands. A system scheduled for replacement in 18 months is a different problem from one that must carry the business for the next decade.
Use operational evidence to see how systems are actually used. Application, access, and integration logs show which features, endpoints, reports, and batch jobs are exercised, by whom, and how often, and which are dead weight. Existing runtime and usage data, such as traffic patterns, job schedules, and error rates, separates what the documentation says from what happens in production. Then inventory the service support tickets for each in-scope application. Ticket volume, recurring failure categories, workaround requests, time to resolve, and the teams that raise them point to fragile components, undocumented processes, and the pain users feel, and they often surface issues that no code scan will. Cluster tickets by application and root cause, and compare them against the static analysis scorecards: a module with modest code debt but constant tickets deserves a closer look, and a module with heavy code debt but no tickets and no usage may be a retirement candidate.
Outputs: a portfolio-wide application inventory with technology stack metadata; architecture dependency diagrams showing inter-system coupling; code-health scorecards per application covering complexity, duplication, and coverage; a CVE findings report with severity ratings and affected components; a process and dependency map of undocumented, off-code workflows tied to each application, with an owner and a failure impact noted for each; a roadmap-alignment view showing planned changes (ERP programs, new integration platforms, retirements) per application.
Step 2, prioritization: rank by business impact
Not all debt warrants immediate action. Some applications are approaching end-of-life. Others sit on the critical path for revenue-generating transactions or upcoming AI initiatives. Prioritization turns the raw findings into a ranked backlog that business and technology leaders can act on together. Score each application across five dimensions:
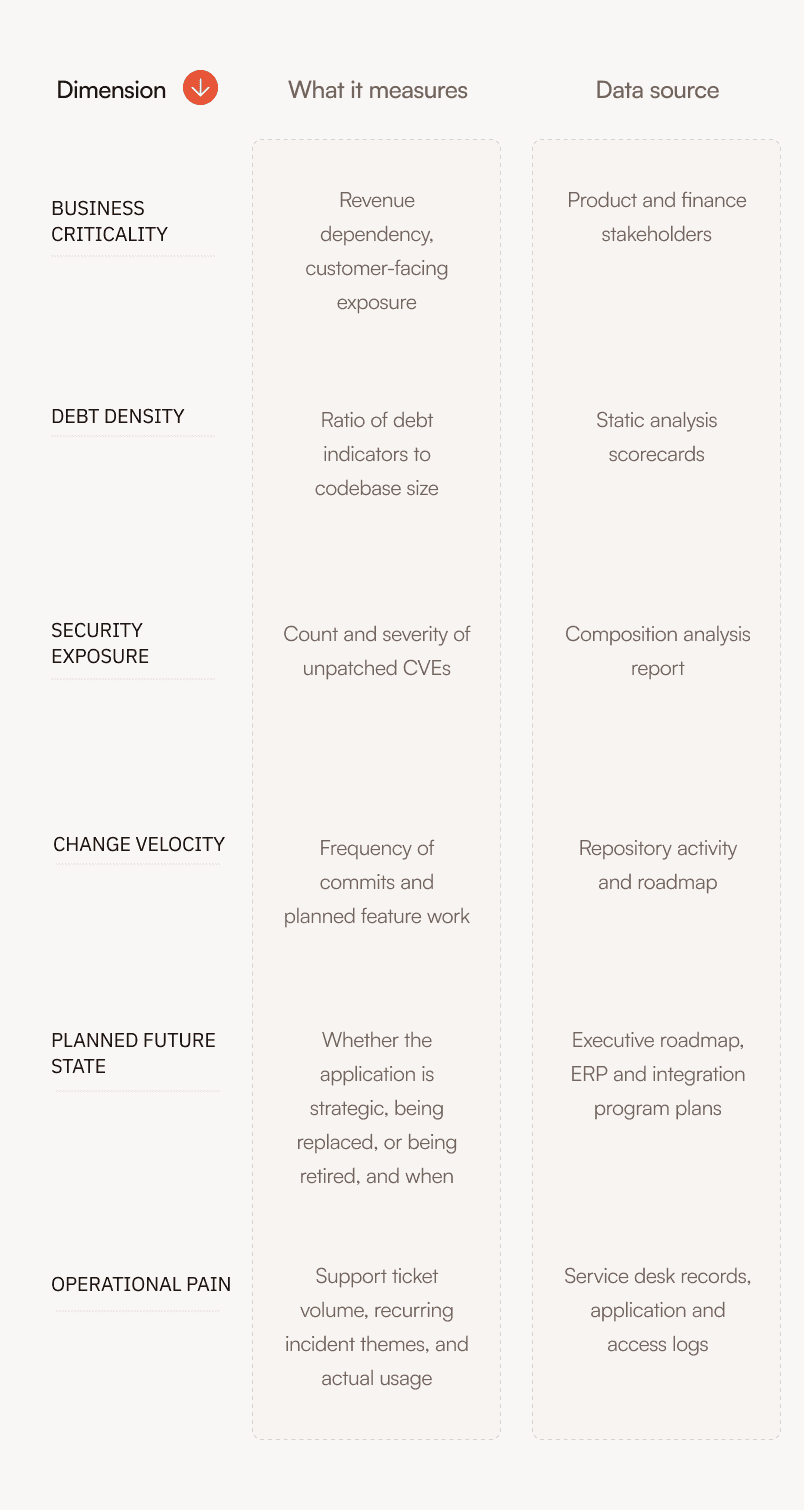
Then assign each application a disposition based on business intent, not just debt score. Invest: modernize because the system is strategic and will be around for years. Sustain: keep it stable and secure with minimal spend, because a planned platform will replace it. Migrate or retire: move its function to the new platform and decommission. Accept: leave it alone because the cost of change exceeds the risk. High debt on a system slated for retirement usually calls for containment (patching critical CVEs, documenting the processes around it, protecting the interfaces the replacement will need) rather than full remediation. The opposite risk also applies: "it will be replaced soon" is a common reason debt never gets addressed, so test the replacement date against the actual program plan and funding.
Fold off-code findings into business criticality: an application that looks low-risk in code but anchors an undocumented, high-impact process should rank higher than its scorecard suggests.
Applications that score high on business criticality and high on debt density move to the top. Applications with low criticality and low change velocity may be candidates for retirement rather than remediation. Outputs: a prioritized improvement backlog sequenced by business impact; a risk-exposure matrix mapping security findings to business-critical systems; retirement or consolidation recommendations for low-value, high-debt applications.
Step 3, remediation planning: sequence the work
Remediation is not a single sprint; it is a multi-quarter program. Sequence work into waves that balance quick wins, such as dependency upgrades and dead-code removal, with structural refactors like service decomposition and API standardization. Assign ownership at the team level. Embed debt-reduction targets into sprint planning so remediation runs alongside feature delivery. Sequence against the programs already in flight, since a new integration platform can make some remediation unnecessary and can make others urgent, for example where a legacy system must expose clean interfaces first.
Outputs: a phased remediation roadmap with effort estimates per wave; defined ownership and acceptance criteria for each backlog item; baseline metrics, such as debt density, CVE count, and release cycle time, against which progress will be measured; a sequencing plan tied to dependent programs, so remediation of retained systems aligns with ERP and integration platform timelines.
Pre-assessment checklist
- Before launching a portfolio assessment, verify these prerequisites are in place. Missing any of them will stall the engagement and increase timelines.
- Repository access granted: every in-scope application's source control (Git, SVN, TFS) is accessible to the assessment tooling with read permissions.
- Documentation audit complete: existing architecture documents, API specs, and data-flow diagrams have been collected and reviewed for currency, and gaps have been flagged rather than filled, since the assessment will validate what exists.
- Dependency mapping initiated: build manifests (pom.xml, package.json, requirements.txt, etc.) are available and CI/CD pipelines can be inspected to trace transitive dependencies.
- Stakeholder interviews scheduled: product owners and engineering leads for each critical application are available to provide business-criticality context during the prioritization phase.
- Environment access confirmed: for runtime analysis such as performance profiling and API traffic patterns, staging or production-equivalent environments are accessible.
- Success criteria defined: leadership has agreed on what "done" looks like, for example a prioritized backlog, a remediation roadmap, a target debt-reduction percentage, or a combination.
- Process owners identified: for each critical application, the operators and business users who run the manual or undocumented processes around it are named and available for walkthroughs, since these workflows will not appear in any repository.
- Roadmap and intent confirmed: leadership has shared planned ERP changes, integration platform timelines, and retirement decisions for in-scope applications, and a named executive owns each decision.
- Logs and ticket history available: application, access, and integration logs and an export of service support tickets (ideally 12 months) for each in-scope application are accessible, along with the people who can interpret them.
How Blueprint.IQ accelerates the assessment
What it does
Blueprint.IQ is Sparq's automated portfolio assessment engine. It ingests source repositories, dependency manifests, and architecture metadata, then produces the outputs described above — application inventory, code-health scorecards, CVE findings, dependency diagrams, and a prioritized improvement backlog — in five days. Most firms scope this same work as a multi-week manual engagement requiring senior architects to read code line by line. Blueprint.IQ automates static analysis, dependency resolution, and architectural pattern detection, then adds expert review to the machine-generated findings. The automation reduces the time spent on manual repository review, letting human reviewers focus on interpreting findings, aligning priorities with business context, and designing remediation sequences that account for organizational constraints.
Because it runs in days, teams can repeat the assessment as AI-assisted code lands, rather than treating it as a one-time exercise. Blueprint.IQ analyzes code, dependencies, and architecture metadata, so mapping off-code processes relies on stakeholder interviews and process walkthroughs led by Sparq's team alongside the automated analysis. Blueprint.IQ findings are inputs to those decisions; business intent and roadmap context come from leadership and stakeholder sessions.
Stacks it supports
Blueprint.IQ analyzes common enterprise technology stacks, including Java and Spring Boot with full dependency-tree resolution, Spring configuration analysis, and microservice boundary detection; Python and Django with requirements-file parsing, ORM complexity scoring, and migration-path analysis; and React and Angular with component-tree mapping, bundle-size analysis, and state-management complexity scoring.
Five days versus multi-week manual timelines
The acceleration does not cut corners. It eliminates the weeks of manual repository spelunking that senior architects typically perform before they can begin prioritization. Automating the identification phase allows human expertise to be applied to interpreting findings, aligning priorities with business context, and designing remediation sequences that account for organizational constraints.
Proof point: conveyor manufacturing leader
When this client engaged Sparq to modernize its data and operational systems, the assessment and subsequent implementation produced measurable results: a 95% reduction in manual data-analysis time, 75% workforce cost savings in the affected operational areas, and lead times cut from six weeks to days. Those outcomes began with an assessment of the existing technical environment that identified where debt and manual processes were consuming resources, followed by a prioritized plan to remediate the highest-impact areas first.
FAQ
Frequent Asked Questions
Learn more.